Measuring Historical Student Data to Improve Early Literacy Outcomes
Today’s teachers and education leaders need a more complete picture of how each student is developing learning skills and concepts over time.
With growing policy support and increasing access to assessment tools, there’s a unique opportunity to shift to data informed instruction and support. That’s where historical student data becomes essential.
But what are the types of historical data, and what systems are currently in place to measure this type of data? How do these data types make a difference in early learning outcomes and what do they have in common?
This article answers these questions and explores how schools can use historical data to build a stronger foundation for overall reading success.
What Is Grade-to-Grade Student Data, and When Should Measurement Begin?

Grade-to-grade student data refers to a chronological record of a child’s educational performance, spanning multiple assessments over multiple years during their learning journey, to reveal trends and recurring patterns.
Its value lies not in single snapshots, but in holistically analyzing the data over time and understanding key learning trajectories.
Is an early learner’s reading on track, improving, plateauing, or declining?
By beginning measurement as early on as possible, and tracking this historical data throughout a child’s early learning years, it’s possible to answer these questions.
Measurement ideally begins in pre-kindergarten, capturing early literacy indicators like oral language, phonics and phonological awareness skills.
While there is no definite end period for such measurement, Grade 3 is widely recognized as a critical milestone year.
Research shows that children who have not learned to read by the end of grade 3 are at a significantly higher risk of not graduating from high school and missing other key educational benchmarks.
What Is Longitudinal Student Data?

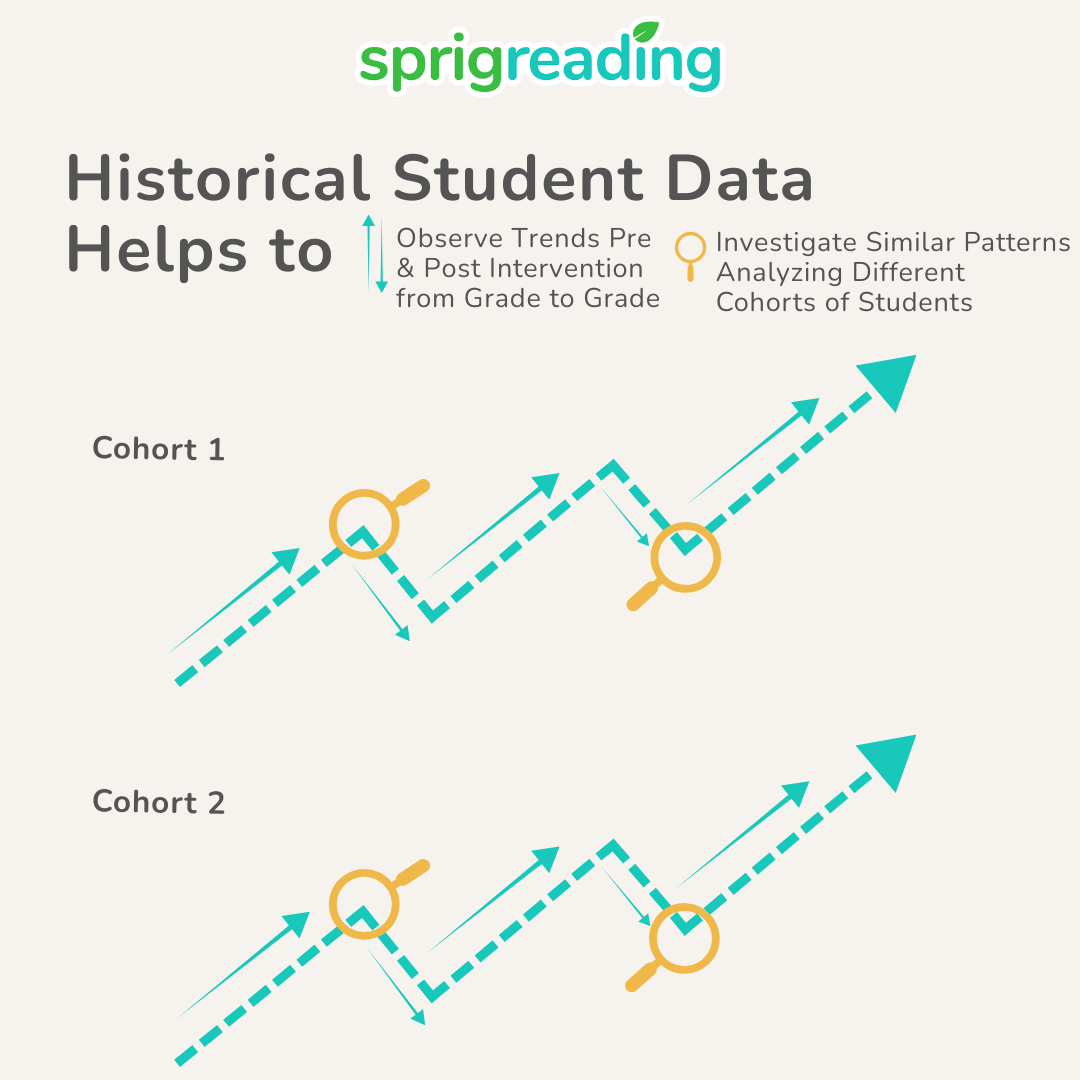
While grade-to-grade student data follows a student’s learning journey, longitudinal student data compares different cohorts of students who have undergone the same journey.
To rephrase the same prior questions for a cohort of students:
Is a certain group of student’s reading improving compared to past years, is it more or less the same as before, or is it worsening compared to past years?
Longitudinal student data helps set baselines as to what ideal reading performance can look like, and how much growth can be expected or achieved.
What Makes Historical Data Profiles Easier to Build?

Two critical systems support long-term tracking of grade-to-grade and longitudinal data:
State Policies on Measuring Student Data
In the US, every state has received a federal statewide longitudinal data systems (SLDS) grant, enabling them to create a system for tracking student data. To date, 33 states have an active SLDS, while an SLDS is under construction for 9 more states.
Among states with an active or under construction SLDS, 35 of them incorporate K-12 data into the SLDS, whereas 30 states incorporate Pre-K data into their SLDS, enabling tracking from preschool through later grades. This is important as children as young as 3 can show early indicators of reading difficulties.
Policies vary, but many emphasize kindergarten entrance assessments, records on school readiness and other metrics. These state data-sharing policies create a continuous data profile, essential for understanding literacy development from the earliest stages.
Mandated Literacy Assessments and Screenings for Schools
Beyond state data systems, the use of required early literacy assessments and screening tools play a key role in maintaining long-term student data profiles.
These tools, administered regularly from Pre-K through Grade 3, gather data across key literacy skill areas, such as phonological awareness, decoding, vocabulary, oral language, and comprehension.
Because they are administered multiple times each year, these assessments provide frequent, consistent data points that can be compared over time.
When the results are stored in a centralized system, whether at the school or district level, educators can make informed decisions that support the student’s learning journey.
Why is Historical Student Data Important?
Long-term student data, measured over several years for one cohort of students (grade to grade) or multiple cohort of students (longitudinal), can help educators and administrators identify trends and patterns respectively.
Trends are directional changes over time (rising performance, stagnation, or decline).
Trends help determine whether learning interventions are effective, if a student is catching up to grade-level expectations, or if they are beginning to fall behind.
For example, if students’ decoding scores steadily improve across multiple checkpoints, it signals a positive response to classroom instruction. Conversely, if a student’s progress stalls or dips, it may prompt a need for an intervention strategy or intensity of support.
Patterns are recurring phenomena across cohorts of students, for instance, every spring a kindergarten class struggles with vowel sounds.
Patterns inform root-cause analysis, which reveal underlying issues that may need to be fixed.
For example, if a large percentage of students score poorly on the same items on a reading screener corresponding to a specific skill over time, efforts must shift to addressing that specific skill with more resources.
Significance of Carrying Data from Grade to Grade
There is something both grade-to-grade and longitudinal data have in common. They both carry each individual student’s data across multiple years of their learning journey.
Historical student data can avoid fragmented decision-making during a student’s transition between grades. When a student moves from Pre-Kindergarten to kindergarten or kindergarten to Grade 1, or any other subsequent transitions, a historical record of their literacy strengths, gaps, responses to interventions help:
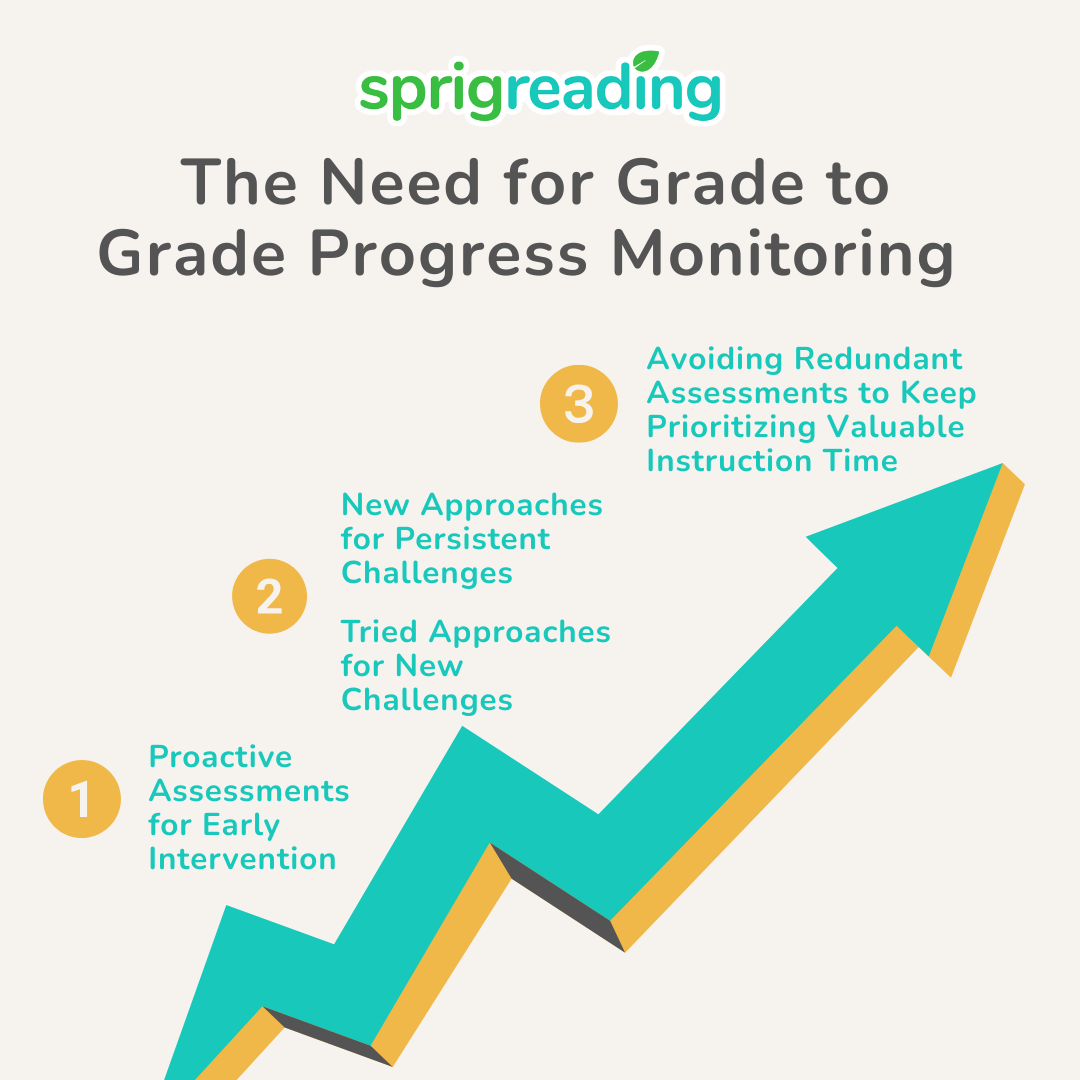
1) Enable early, appropriately targeted interventions instead of reactive ones.
By analyzing trends and patterns from previous years, educators can spot anomalies early in the school year and intervene promptly, before challenges become entrenched.
In the early years, every day, week, and month is formative, making timely action essential for long-term success.
Margaret Goldberg, literacy coach and co-founder of the Right to Read Project, advocates for identifying students who need early intervention and supporting them before they encounter serious difficulties.
However, she notes that most school districts and schools struggle to effectively use predictive data to guide these efforts.
2) Confirm whether identified struggles are persistent or new.
This distinction matters, as persistent struggles may require a fresh approach, while new challenges may be addressed by existing support systems already in place.
3) Avoid redundant assessment to prioritize instructional time.
While reassessment is valuable for checking retention of key concepts, students may have other areas that require more immediate attention.
In such cases, it’s often more effective to prioritize instruction in those areas rather than spending additional time on further assessments.
Lessons for Historical Student Data in Early Learning

Pre-K to 3 is Especially Important for Historical Student Data Collection
Several innovative projects are advancing our understanding of historical student data. One example is the ongoing Pre-K to Third Grade ExCEL P3 Study. This study explores whether the academic boost gained in pre-K can be sustained through third grade with the right combination of curriculum and professional development.
With the rise in student data availability, driven by new state policies on data tracking and mandated assessments, there’s a growing urgency to determine how to use this information most effectively.
One thing is clear, i.e., robust early literacy systems must rely on historical student data that starts in Pre‑K and follows through at least until Grade 3.
While many states support these systems through statewide longitudinal data initiatives and assessment mandates, it ultimately falls to individual schools and teachers to implement them effectively.
Ensuring that historical data truly informs decision-making requires educators to actively observe and respond to the trends and patterns described in this article.
Historical Student Data Usage is As Important as Collection. Integrating Data Into Teaching Practice is Most Essential!
A study published in the Early Childhood Education Journal by the University of Nebraska examined how teachers in Pre-K to Grade 3 use data. It found that educators commonly use data for a variety of purposes, with the most frequent being to inform instruction and determine whether students are consistently ready to learn new skills.
In contrast, data were least often used for accountability purposes, such as demonstrating progress or outcomes to school or district administrators.
Overall, teachers across all grade levels reported similar patterns of data use.
Teachers can gather valuable insights into student reading skills through various methods, including administering assessments, analyzing work samples, observing literacy tasks, and conducting student interviews.
Using a combination of these approaches provides the most comprehensive understanding of each learner’s progress and needs.
This is a lot of data and it evolves over time!
It must be entered in a way that is efficient so it becomes common practice. It must also be easy to manage for the sake of demonstrating progress!
Sprig Reading makes it easy to monitor progress for every student from grade to grade!
Teachers can input student progress in a way that is quick and intuitive, and also use certain reporting features to monitor and communicate growth and gaps throughout the early learning years.
They can collaborate with other members of staff to make sense of this data and make informed instructional decisions with confidence.
Evidence-based reading does not only include teaching the right foundational skills, which is essential, but also collecting longitudinal data through ongoing assessments, so every student can get the help they need.
If you liked this article, you may be interested in learning more about the type of assessments that are available for collecting all of this longitudinal data.
Check out:
What to Do With Early Literacy Assessments? Easy Framework To Make The Right Decisions.
Progress Monitoring Assessment and Benchmark Screeners in Early Literacy. Doing One or Both?